
How to Measure Internal Resistance of a Battery
Table of Contents
Introduction
A commonly encountered school-level Physics practical is the determination of the internal resistance of a battery – typically an AA or D cell. Typically this is based around a simple model of such a cell as a source emf in series with a small resistor. The cell is connected to a resistive load and (in the simplest case where load resistance is known) only open circuit voltage and load volts need to be measured.
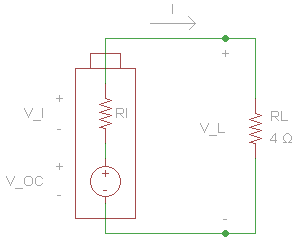
Then: $$r_i=\frac{V_I}{I} =\frac{\Delta V}{I} $$ where $$\Delta V = V_{OC}-V_{L}$$ and $$I=\frac{V_L}{R_L} $$.
It should be noted that the above representation of a battery as a simple constant voltage source in series with a small resistor is a convenient simplification of quite complex battery chemistry. In practice, one finds that neither the open circuit voltage (emf) nor the internal resistance remains constant as is assumed in this model. Both vary depending upon the “state of charge” (SOC) or “depth of discharge” (DOD) of the battery. So experiments to determine internal resistance should be confined to loads for which there is minimal or negligible discharge during measurement. There are more complex electrical models of battery chemistry and these will better approximate the battery’s time-dependent electrical output during discharge.
In this article, we begin by describing difficulties experienced attempting the direct measurement described above. We then discuss the “classic” school experiment for the determination of internal resistance and develop some approximation formulas. These may be used to determine circuit parameters from regression analysis of current vs conductance or load voltage vs conductance as well as the “traditional” load voltage vs amps.
Finally, we revert to the original simple method of direct measurement albeit by exploiting the “battery test” setting found on (some) multimeters. This setting does no more than provide a resistive load for the battery under test and the “battery test” voltage reading is therefore a load voltage. As meter leads carry current from the battery terminals through the load, we have to take into account lead resistance when using this method.
Experimental Brief
In the particular “experimental brief” given to some students attending lessons here, internal resistance was to be determined using a “homemade” resistor of approximately ##\;4 \Omega## for the load. Measurements of open circuit voltage, terminal (load) voltage, and current were to be made with a single multimeter. One soon discovered that an ##\approx 4 \Omega## resistor connected to a typical AA cell would draw a substantive current and that measurement of terminal voltage was problematic on account of that voltage dropping even as the measurement was taken. Current measurements suffered similarly. On the other hand, if load resistance were increased to try and ‘stabilize’ the readings, one would find there was scarcely any terminal voltage drop. So the requirement is to try and find a resistance or resistance range whereby the current drawn throughout measurement would not significantly affect open circuit (and hence terminal) voltage whilst at the same time providing a measurable terminal voltage drop.
Revised Experimental Brief
The classic school experiment to determine the internal resistance of a cell does not require the measurement of open circuit voltage since this parameter is instead determined from linear regression. It is the y-intercept of a straight line having a gradient equal to the cell’s internal resistance according to the equation: $$V_L = \textbf{ℇ} – Ir_i$$ Here ##I## and ##V_L## are the x and y variables respectively with ##\textbf{ℇ}## – the cell emf – and ##r_i## – internal resistance – being obtained as regression coefficients of the y-intercept and gradient respectively. By the original experimental brief (using a “homemade” resistor), the current was varied by using an exposed pencil lead as a variable resistor. A second pencil lead was used as a current limiting resistor (##R \ge 8.8 \Omega##). It was not expected that students would have more than one multimeter at their disposal.
Strictly speaking, it is only necessary to take current and voltage readings but here we include resistance readings as well. We need to discuss why there is a discrepancy between the measured resistance values (first column of the table below) and Ohm’s law calculated values (last column of the table below). Another salient point about this dataset is that the open circuit voltage has remained more or less constant throughout the set of readings. This is very important since a constant cell emf is assumed in the equation ##V_L = \textbf{ℇ} – Ir_i.##
Contrary to the original experiment brief (indicating the use of only one meter), it is necessary to use two meters – one for the amps and one for the volts. The reason is that readings of voltage and current need to be taken simultaneously to ensure that the pairs match up correctly. If (for example) a multimeter was used first to measure volts and then (separately) amps, the readings would NOT match up because when the multimeter measures current, it automatically introduces non-negligible resistance into the circuit. This experimental detail was observed by the author. Still, the reason was not appreciated until being advised about it in a PF discussion thread on the same topic (battery internal resistance).
Table of Measurements and Calculated Values
| Resistance | Current | Open circuit volts | Load Volts | R calculated |
| (Ohms) | (milli-amps) | (milli-volts) | (milli-volts) | (Ohms) |
| 8.8 | 138.4 | 1521 | 1486 | 10.74 |
| 18.6 | 73.8 | 1523 | 1501 | 20.34 |
| 23.9 | 58.6 | 1521 | 1505 | 25.68 |
| 13.6 | 97.6 | 1522 | 1495 | 15.32 |
| 21.7 | 63.8 | 1521 | 1503 | 23.56 |
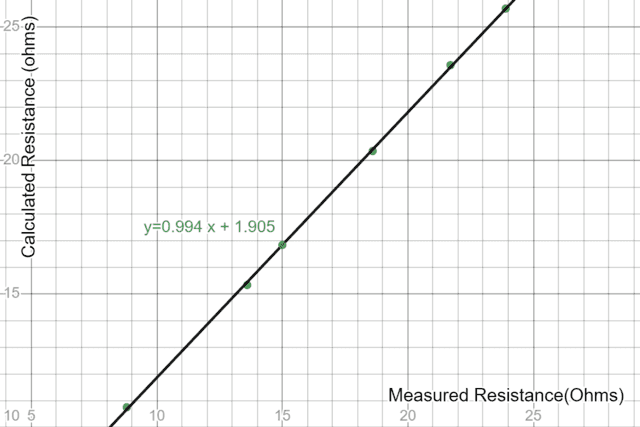
Regression Analysis: Measured vs Ohm’s Law calculated Resistance
A plot of calculated resistance vs measured resistance yields (as expected) a gradient ##\approx 1## but there is a definite “offset” or y-intercept value (##\approx 1.9 \Omega##) which this author (anyway!) could not find any explanation for.
https://www.desmos.com/calculator/mw5bq32df9
A query was put on PF and the following explanation was obtained from PF user @TomG:
You mentioned that you used the same meter to measure the current. The Current range of a digital ammeter has some low, non-zero, internal resistance, which would add to your effective load resistance. Has this been taken into account?
https://www.physicsforums.com/threads/battery-internal-resistance.1016677/post-6650450
So the offset indicated in the regression analysis above arises from the fact that when the current was measured, an additional resistance (that of the ammeter) was introduced into the circuit. When we plot load voltage vs current, this does not matter since the measured current is for the total circuit resistance and corresponds to a matching load voltage measurement. However, we should certainly be asking questions as to why Ohm’s law calculation of resistance yields values that are nearly 2 ohms different from the measured values.
Even with an ##8.8\;\Omega## current limiting resistor, there were still problems with fluctuating voltage measurements when using a single AA cell. For this reason, the above dataset was measured with 2 similar AA cells in parallel on the understanding that the internal resistance obtained would be half that for a single AA cell. However, this setup is not ideal since it is by no means guaranteed that even similar AA cells will have the same internal resistance. The parallel connection also introduces problems with ‘fitment resistance’ – a topic to be further discussed in this article. Be that as it may, it is still instructive to examine graphs and regression analysis of the data obtained.
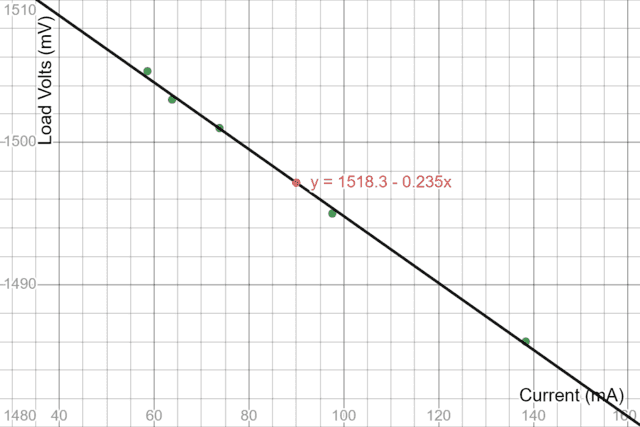
Regression Analysis: Load Voltage vs Current
https://www.desmos.com/calculator/3cqsrmwbvv
The plot above is typical of what one might expect from the “classic school experiment” described in the video link above. For the parallel pair the regression fitted ‘trendline’ shows an internal resistance of ##\approx 0.235 \;\Omega## and a (parallel) cell emf of ##\approx 1518.3\; mV##. The latter is very close to the measured open circuit voltage(s) in the dataset above. The discrepancy (about 3 milli-volts) is most likely due to “fitment resistance”. When attempting to determine a resistance value as low as that obtained above, one needs to be very aware of various small resistance values that could affect the value obtained. For example, one set of test leads that I used has a resistance of about ##0.113 \Omega## and one has to carefully consider when and when not lead resistance will impact upon the determination of an AA cell’s internal resistance.
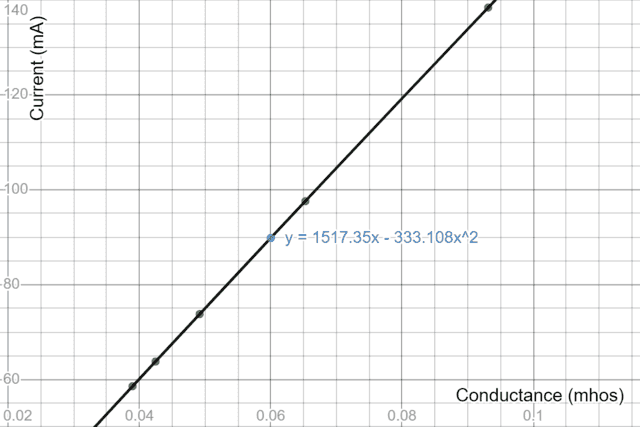
Regression Analysis: Current vs Conductance
Consider the equation: $$ I = \frac {\textbf{ℇ}}{R+r_i}=\frac {\textbf{ℇ}}{R\left(1+\frac{r_i}{R}\right)}\approx \frac{\textbf{ℇ}}{R}\left(1-\frac{r_i}{R}\right).$$ The approximation is obtained from a one-term binomial expansion of ##\left(1+\frac{r_i}{R}\right)^{-1}## and will be increasingly accurate the smaller ##r_i## is against R – ie for ##r_i<<R##. In terms of conductance G (reciprocal of resistance), we may re-write the approximation as $$I\approx\textbf{ℇ}G-\textbf{ℇ}r_i G^2$$ and a quadratic regression analysis of the plot I vs G should yield the same parameters (##r_i## and ##\textbf{ℇ}##) as the linear model. To obtain conductance readings, we use the existing dataset values by calculating the quotient ##\frac{I}{V_L}##. We previously indicated why there would be a problem with the more direct method of calculating conductance as the reciprocal of resistance. All the same, this particular regression analysis is more suited to determining internal resistance from direct measurements of current and conductance. Perhaps by using a non-intrusive Hall effect current sensor.
https://www.desmos.com/calculator/qhojl7ly1k
The graph is strikingly linear and we should expect that since from the equation the term ##\textbf{ℇ}G## (representing an ideal battery) is by far the major component with the quadratic “correction” term being very small. Nonetheless given that the quadratic co-efficient is the product ##\textbf{ℇ}r_i## and the co-efficient of the linear term is just ##\textbf{ℇ}##, we can divide the first by the second to yield a value of ##0.22\;\Omega## for ##r_i## in good agreement with the earlier value obtained by linear regression of load voltage vs current. Whether quadratic regression has any particular statistical advantage as compared to linear regression is a question we will have to leave to the statistics ‘gurus’. In terms of the Excel ‘trendline’ fit above, we have set a zero intercept since theoretically there is no constant term in the equation. However, a forced zero intercept may not be ideal from a statistical perspective.
In principle, we should be able to use just one meter for this method since technically only a current reading is required. However, this would mean that we are using precisely known values of resistance/conductance as well as a similarly precise value of ammeter resistance. This is not that easy to realize in practice unless one has an instrument such as a milli-ohm meter (a second meter anyway!). And preferably a non-intrusive Hall effect current sensor!
Regression Analysis: Load Voltage vs Conductance
Consider again the equation: $$ I = \frac {\textbf{ℇ}}{R+r_i}=\frac {\textbf{ℇ}}{R\left(1+\frac{r_i}{R}\right)}.$$ Given ##r_i<<R##, a mathematical ‘trick’ we can use to good effect here is to write $$1+\frac{r_i}{R} =1 + r_iG \approx e^{r_iG}$$ so that: $$ I \approx {ℇ}{G}e^{-r_iG}\implies V_L= {ℇ}e^{-r_iG}. $$ The advantage of this re-arrangement is that exponential regression on load volts vs conductance will immediately yield a value for ##r_i##. And for plotting purposes, one could calculate conductance directly as the reciprocal of measured resistance albeit again needing to know the resistance values as accurately as possible.
In principle, we do not need a current measurement and hence need not be concerned with the associated complication of ammeter resistance. However, in this particular case, our table of readings above was already obtained using the “two-meter” method so we are again determining conductance as ##\frac{I}{V_load}##. Ideally, this particular regression analysis should be used to determine internal resistance from direct measurements of load voltage and conductance if we can accurately measure conductance or can source high-accuracy resistors.
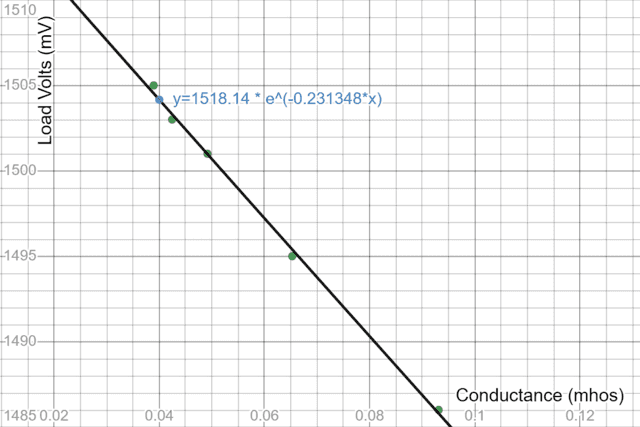
https://www.desmos.com/calculator/kngmrtkriz
The graph seems linear rather than exponential for the simple reason that over the particular domain of conductance values, the exponential is indeed well approximated by a 1-term linear expansion. However the exponential regression fit immediately yields ##r_i=0.231 \Omega## and ##\textbf{ℇ}=1518.14\;mV##. The constant should indicate the open circuit voltage but here there is a discrepancy since the measured open circuit voltage is about 1521 millivolts. The most likely cause of this discrepancy is “fitment resistance” whereby there is a short stretch of conductive material from the battery terminal to the point at which the voltmeter (measuring load volts) is attached. When the battery draws current to supply a load, this introduces a small voltage drop which would not be there if the voltmeter were connected directly to the battery’s positive and negative terminals.
An Alternate Method using Battery Test Mode
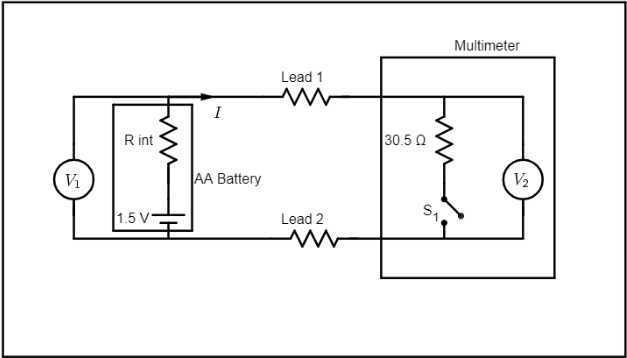
On one of the two meters used for this experiment, there is a “battery test” setting for either 1.5-volt or 9-volt batteries. It appears that this setting places a load of 30.5 Ohms onto the battery (the 30.5-ohm value was obtained from an Ohm’s law regression analysis) and the voltage measurement (in the battery test setting) is directly across this resistance. This is very useful since now one is immediately able to calculate circuit current by dividing the measured voltage by 30.5. The open circuit voltage of the battery can also be measured and the voltage drop (under load) can hence be calculated. Dividing this voltage drop by circuit current yields internal resistance. A note on the load resistor value of 30.5 ohms is that it was probably carefully chosen as being representative of a “mid-range” AA battery load. The corresponding current draw is about 50 milliamps and an AA cell datasheet will show a “mid-range” discharge curve as measured at this current.
Unfortunately however, as pointed out by PF member @sophiecentaur, there is a complication with this method primarily because it is NOT a four-wire measurement (we could make it so as described in the Appendix below). Load current flows from the battery (under test) through the meter leads en route to the load resistance (inside the meter) so the value of ‘internal resistance’ obtained will be the sum of lead resistance and battery internal resistance.
This complication may be dealt with by taking measurements using 2 separate sets of leads (preferably identical pairs) and a third measurement in which both pairs of leads are connected in series. The circuit diagrams below show these 3 measurements. Note that open circuit voltage is nominally shown as 1.5 volts whereas the actual value depends upon the AA cell one is testing/measuring. Note also that in the diagrams, each pair of leads is represented by two resistors but ##R_2## and ##R_1## refer to the resistance of the respective lead pairs. ##R_{int}## is the internal resistance of the AA cell. The ##30.5\;\Omega## resistor is internal to the multimeter and connects when one switches from reading DC voltage (open circuit) to DC load voltage under the “battery test” setting.
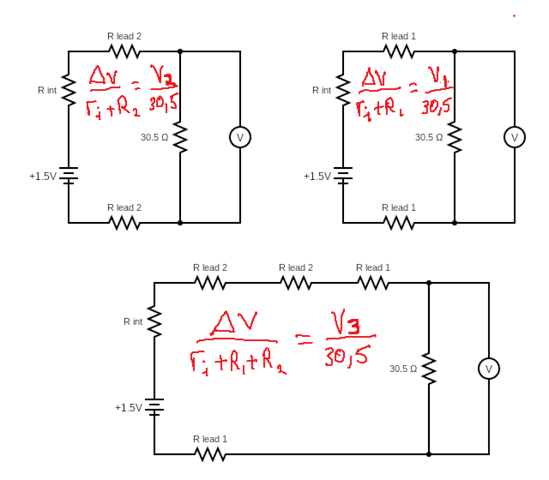
$$r_i = (r_i + R_1) + (r_i + R_2) – (r_i+R_1+R_2) $$ $$R_1 = (r_i+R_1) – r_i$$ $$R_2= (r_i+R_2) – r_i$$
Serendipitous by-products of this set of measurements are resistance values for the two sets of lead being used. It should be noted that since a 1 millivolt drop corresponds (roughly) to a resistance value of 22 ohms, the latter is the resolution limit of this measuring system and the resistance values are all ##\pm 11\;m\Omega##. Once lead resistance is known, a single measurement will suffice for measuring the internal resistance of any other AA cell.
Table of Results: 4 Varta AA 2100 mAh batteries
| Battery | Voc mV | V1 mV | V2 mV | V3 mV | ri+R1 ohms | ri+R2 ohms | ri+R1+R2 | |
| 1 | 1368 | 1360 | 1363 | 1358 | 0.179 | 0.112 | 0.225 | |
| 2 | 1366 | 1358 | 1361 | 1356 | 0.180 | 0.112 | 0.225 | |
| 3 | 1365 | 1357 | 1360 | 1355 | 0.180 | 0.112 | 0.225 | |
| 4 | 1365 | 1357 | 1360 | 1355 | 0.180 | 0.112 | 0.225 | |
| ri ohms | R1 ohms | R2 ohms | Alternate | ri+R1 ohms | ri+R2 ohms | ri+R1+R2 | ||
| 0.067 | 0.113 | 0.045 | Calculation | 0.179 | 0.112 | 0.224 | ||
| 0.067 | 0.113 | 0.045 | 0.179 | 0.112 | 0.224 | |||
| 0.067 | 0.113 | 0.045 | ri + R = | 0.179 | 0.112 | 0.224 | ||
| 0.067 | 0.113 | 0.045 | 30.5*ln(Voc/Vl) | 0.179 | 0.112 | 0.224 |
Low Resistance Measurement
In the above setup, there is of course nothing to prevent us from replacing the second set of leads with any low resistance value. So we have yet another serendipitous by-product of this measurement technique. Namely it can be used to measure any low resistance values to an accuracy of ##\pm 11 m\Omega##. This is an order of magnitude better than the resistance scale on the meter itself which is only good to ##0.1 \Omega##.
An example of practical use of this technique arose when the author attempted to measure the resistance of a set of 12-volt battery jump leads. It was discovered that the resistance was far too high (about 800 milli-ohms) and subsequent investigation revealed very poor crimp connections to the terminating alligator clips. The leads were taken to a TV repair shop where the connections were soldered down properly and the jump leads now measure in at just 45 milliohms.
Several different lengths of galvanized steel wire were measured and the proportionality between resistance and length was verified. Of course, a milliohm meter will do this task equally well but consider cost factor vs a ‘run of the mill’ multimeter such as the one this author has used for the above measurements! One brings within easy sight, the important resistance range between 0 and 1 ohms wherein lies a treasure trove of interesting scientific and/or engineering information!
Thévenin Equivalent Circuit
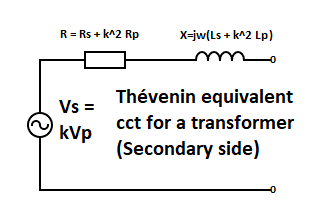
Circuit representation as a resistance (impedance in the case of a sinusoidal source voltage) in series with a constant voltage source is known as a Thévenin equivalent circuit and finds extensive use in many scientific and/or engineering applications in which complex physical/electrical systems are simplified accordingly. The battery circuit discussed in this article is one such example. Another very useful example is that of a transformer in which, looking into the two terminal secondary side, we see a simplified Thévenin equivalent consisting of an AC voltage source (primary voltage times turns ratio) in series with an impedance R + jwL where R is a sum of secondary winding resistance and ‘stepped up’ primary winding resistance. The same applies to the inductance L. The ‘step up’ co-efficient is the square of the turns ratio k.
Similar circuits are used to represent each phase of 3-phase synchronous motors and 3-phase induction motors
Summary and Conclusion
In this article, we have explored various forms of regression analysis that may be used to determine the internal resistance of a battery (AA cell in particular). Given the 3 variables present in Ohm’s Law calculations, we can plot any two against each other and obtain internal resistance by appropriate regression analysis. We have mentioned various practical problems (and solutions) associated with collecting such data sets.
We have also described an entirely different technique for determining internal resistance by exploiting the “Battery Test” setting which some digital multimeters make available. This technique also enables the measurement of low resistance values in general. Low resistance measurement makes possible a range of different school science practicals as well as finding applications in measuring the resistance of (for example) battery jumper cables! Or for measurements of motor and transformer windings and for checking the quality of electrical connections.
The modeling circuit for a battery consists of a constant voltage source in series with a resistor. This is known as a Thévenin equivalent circuit and it is often possible to break down complex circuitry into its Thévenin equivalent. When the source voltage is sinusoidal, the Thévenin equivalent will show an AC source with fixed frequency (typically 50Hz) in series with an impedance represented by a complex number.
Acknowledgments
This article stems from a long thread on battery internal resistance which the author initiated after experiencing some technical difficulties with an associated school practical Several PF mentors: contributed to this thread and I would like to thank each of them for the many helpful tips and practical advice on how best to conduct experiments/measurements of this nature. I have taken the liberty of including links to particular posts from PF users @DaveE and @Tom.G whilst the development of “An Alternate Method” was assisted in no small measure by comments from @SophieCentaur.
The same PF users contributed further suggestions when I posted this article for review. In addition, PF user @Anorlunda suggested the inclusion of a paragraph or two on the “Thévenin equivalent circuit” noting that the electrical model of a battery is an example of such. PF user @Rive suggested an early discussion of this model’s limitations and PF user @.Scott made the point that internal resistance is best measured using a representative load. @Steve4Physics reinforced the point that measurements should be taken quickly to avoid changes in battery emf as well as battery heating which could affect the resistance measurement.
Perhaps too often, we take this for granted but without @Greg there would be no PF and no platform for insights such as the above.
Finally, I would like to sincerely thank Clinton and Douglas at Armcoil Afrika who were extremely tolerant putting up with some kind of crazy nerd wanting to do low resistance measurement! They allowed me to measure a couple of transformer windings (the readings compared favorably with those obtained on Armcoil’s own kit) as well as using their own equipment to verify resistance readings I had obtained on various lengths of galvanized steel wire. Some standard resistors were also measured. For example a ##4.7 \Omega## resistor was measured at ##4.669 \Omega##.
Appendix A: Measurement of Internal Resistance and Low Resistance
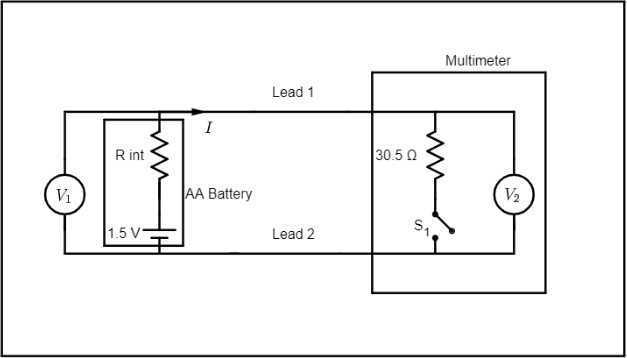
Consider the above circuit which represents an AA cell being measured for open circuit voltage (##S_1## open) and under load (##S_1## closed). ##S_1 ## open corresponds to the multimeter in ordinary DC voltage measurement setting whilst ##S_1## closed corresponds to the meter being in the “Battery Test” setting. The current flowing in the circuit with ##S_1## closed is easily calculated by dividing load volts by the fixed resistance value of 30.5 ohms. The difference between open circuit voltage and load voltage ##\Delta V## should correspond to the voltage drop across the battery’s internal resistance and dividing that by the current yields internal resistance. In this case, the two voltmeters shown are redundant since they are both (in effect) measuring directly across the battery terminals.
The problem with the above circuit diagram is that it shows the battery connecting to the voltmeter via a pair of leads of zero resistance. In the next diagram, the circuit is redrawn to show (more realistically) the battery connected to the voltmeter via a pair of leads of fixed resistance.
The voltage difference between cell emf and load voltage ##V_2## ie: ##\Delta V_2## now represents the voltage drop across battery internal resistance in series with lead resistance. So in essence the battery’s internal resistance has been ‘extended’ to include lead resistance. In effect, we could return to our first circuit and replace the battery’s internal resistance with its original value plus the combined lead resistance.
If we were incautious enough to make use of a battery holder (rather than placing meter probes directly onto the battery terminals), we would introduce a further ‘extension’ of internal resistance on account of the battery holder’s “fitment resistance”. For this reason, the probes of Voltmeter ##V_1## must indeed be in direct contact with the battery terminals so that they do not measure anything other than the voltage drop across the battery’s internal resistance.
The above arrangement is equivalent to a standard 4-wire measurement of internal resistance since Voltmeter ##V_2## could be replaced by an ammeter so that current is directly measured. It is not a concern that the ammeter would add resistance to the circuit as long as we ensure voltmeter ##V_1## measures directly across the battery terminals. Then ##r_i=\frac{\Delta V_1}{I}## as before. A detailed description of the 4-wire measurement of internal resistance is provided by PF user @DaveE in one of the posts from a thread on this same topic (battery internal resistance). The reader would be well-advised to study this description taking careful note of the experimental detail. We regard this as the “gold standard” for measuring the internal resistance of AA cells.
The advantage of the arrangement in the circuit diagram(s) above is that it enables additional low resistance measurements other than just battery internal resistance. For example in the second circuit diagram above, we can easily obtain the meter’s lead resistance since the voltage drop across the (combined) leads is simply ##V_1-V_2##. Current (as before) is obtained as ##\frac{V_2}{30.5}## and a simple Ohm’s law calculation then gives the (combined) lead resistance. Once we have established a value for lead resistance, there is nothing to prevent us from inserting additional resistance between ##V_1## and ##V_2## and measuring the changed voltage drop. The value of total circuit resistance may be easily calculated by Ohm’s law and the deduction of lead resistance plus battery internal resistance provides a measure of the additional inserted resistance.
A final point worth noting is that an ‘upmarket’ commercial meter such as the Fluke 87 can measure low resistance to the same or better order of accuracy. A specific instruction given in an “Applications Note” on low resistance measurement, is to connect leads together and internally record lead resistance so that its value may subsequently be “zeroed out”. The reason for doing this is exactly as described above.
Appendix B: Measuring “Battery Test” Resistance
This is probably the simplest ever application of Ohm’s Law! When set to “battery test”, the multimeter reads a voltage across a fixed resistive load. All that needs to be done is to place an ammeter and variable resistor (an exposed pencil lead was used) in series with the multimeter’s internal “battery test” resistor. When this circuit is powered from an AA battery, current varies with (external) resistance so a set of current/voltage readings may be taken and plotted on a regression curve. Since ##V=IR##, the gradient of the plot gives the value of the “battery test” resistance value.
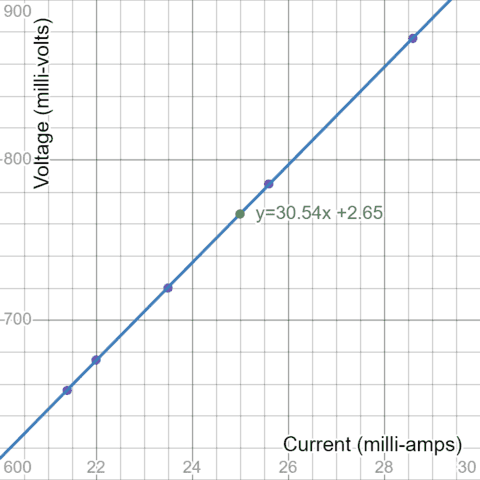
https://www.desmos.com/calculator/7zojmulw95
References
| [1] | PF Contributors. Battery internal resistance | physics forums.https://www.physicsforums.com/threads/battery-internal-resistance.1016677/, February 2023. |
| [2] | PF Contributors. Request for review: Measurement of battery internal resistance | physics forums. https://www.physicsforums.com/threads/request-for-review-measurement-of-battery-internal-resistance.1049511/, February 2023. |
| [3] | PF User DaveE. (1) battery internal resistance | page 2 | physics forums.https://www.physicsforums.com/threads/battery-internal-resistance.1016677/page-2#post-6652268, July 2022. |
| [4] | Duracell. Mn1500.https://www.duracell.com/wp-content/uploads/2016/03/MN1500_US_CT1.pdf, February 2023. |
| [5] | VARTA Consumer Batteries. Microsoft word – datasheet-ready2use-56706-2. https://lumstatic.com/vl/SG/4FN8Tmj62tFqV0lsWg.pdf, March 2007. |
| [6] | CAMI. 4 wire testing | resistance measurement to within 1mΩ | article.https://www.camiresearch.com/Campaigns/Web-Articles/4-wire-testing.html, February 2023. |
| [7] | Fluke. Low ohms measurements you can trust.https://dam-assets.fluke.com.cn/s3fs-public/2140111_6003_ENG_A_W.PDF, 2004. |
| [8] | Major Tech. Major tech mt870 instruction manual pdf download | manualslib.https://www.manualslib.com/manual/2218076/Major-Tech-Mt870.html. |
| [9] | Measuring internal resistance – practical – a level physics – youtube. https://www.youtube.com/watch?v=SMmgtGIUQhk. |
- BSc (Elec Eng) University of Cape Town, HDE University of South Africa
- Maths and Science Tutor, Florida Park, Johannesburg
- Research areas (personal interest): Hydrogen / Hydrogen-like spectra. Historical Maths.
- Wikipdedia contributions: Ptolemy’s Theorem, Diophantus II.VIII, Continuous Repayment Mortgage


Leave a Reply
Want to join the discussion?Feel free to contribute!