Learn About Relativity on Rotated Graph Paper
This Insight is a follow-up to my earlier tutorial Insight (Spacetime Diagrams of Light Clocks).
I gave it a different name because I am placing more emphasis on Relativity and invariance, and I want to discuss more advanced methods involving “causal diamonds” (rather than just the “clock diamonds” in the earlier Insight). I will assume that the reader has read the earlier Insight.
The details are presented in my recent paper (“Relativity on Rotated Graph Paper”, Am. J. Phys. 84, 344 (2016); http://dx.doi.org/10.1119/1.4943251 ).
Table of Contents
Clock Diamonds (a summary)

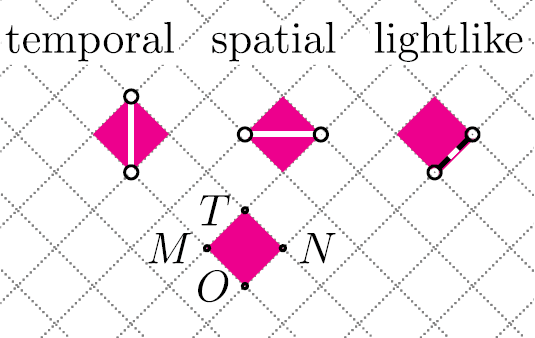
As discussed in the earlier Insight, the grid on the rotated graph paper is based on the clock diamonds of Alice, an inertial observer at rest in this spacetime diagram. These clock diamonds provide a way to visualize the tickmarks on Alice’s time and space axes—and to do calculations based on counting clock diamonds using simple arithmetic.
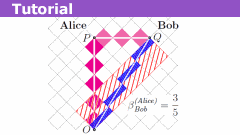
What about Bob’s Clock Diamonds (##V_{Bob}=3/5##)?
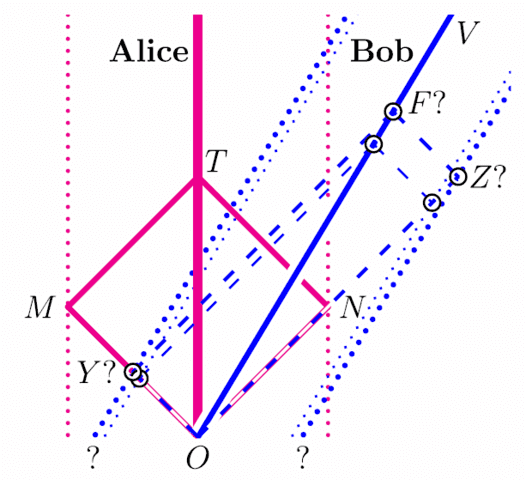
Calibration Problem for Bob’s Clock Diamonds
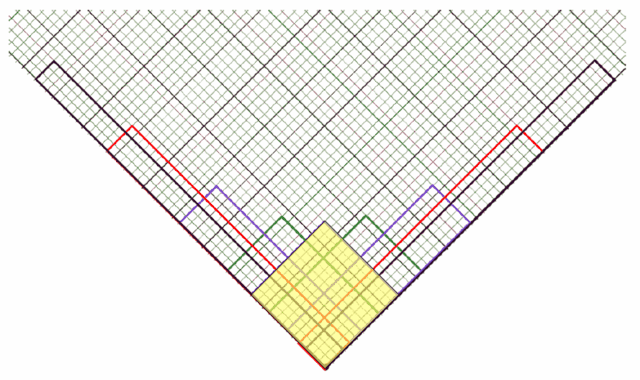
The earlier Insight provided a method to visualize the clock diamonds for other inertial observers. The essential idea is to exploit the fact that
Bob’s clock diamond OYFZ
has the same area as
Alice’s clock diamond OMTN.
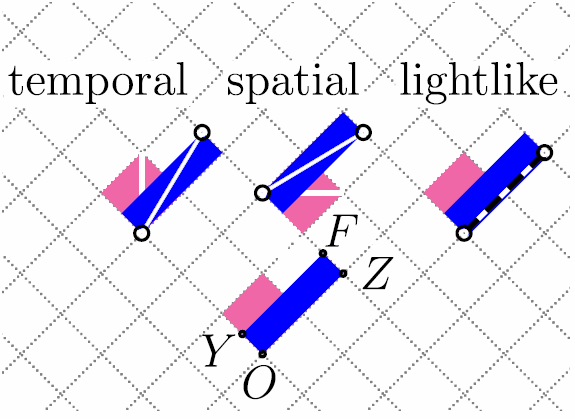
Graphically, we deform Alice’s diamond by stretching ON to OZ by a factor ##k## and shrinking OM to OY by the same factor… so that OF is along Bob’s worldline and OYFZ has the same area as OMTN. This factor ##k## can be shown to be the Doppler-Bondi factor (##k=\sqrt{\frac{1+V}{1-V}}##). (In fact, ##k## and its reciprocal are the eigenvalues of the Lorentz Transformation, whose eigenvectors are the lightlike-directions in the grid.)
While it is useful to visualize the tickmarks for other inertial observers, this method (emphasizing graphing and counting diamonds) gives exact results only when the relative-velocities of these observers have Doppler-Bondi factors that are rational numbers: Bob with ##V_{Bob}=3/5## has ##k_{Bob}=2## and Carol with ##V_{Carol}=4/5## has ##k_{Carol}=3##. Graphically, this is made easier by subdividing the grid into, say, a 6 x 6 subgrid. We show velocities ##0, 5/13, 3/5, 4/5## and their negatives, with corresponding k-factors ##1, 3/2, 2, 3## and their reciprocals. (The restriction to rational Doppler-Bondi k-factors can be expressed in terms of Minkowski-right triangles with sides forming Pythagorean triples.)
We wish to overcome
the restriction to velocities with rational Doppler-Bondi k-factors.
Causal Diamonds
A clock diamond is a special case of a causal diamond.
The causal diamond of OQ is the set of events that can receive signals from event O, and then send signals to event Q. On rotated graph paper, this is a parallelogram OPQR with timelike diagonal OQ, with edges parallel to the lightlike gridlines, labeled by coordinates u and v (sorry, this v is not velocity).
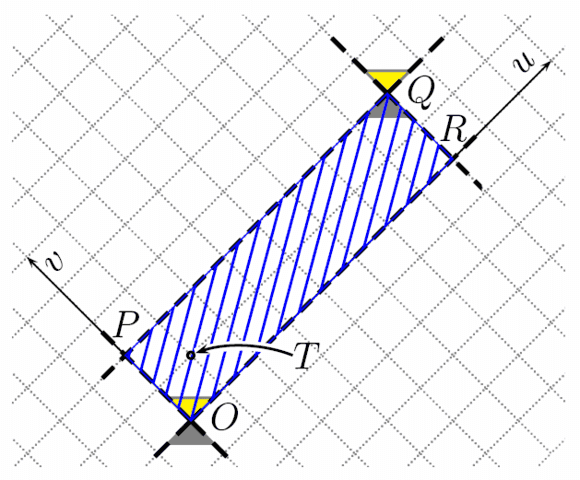
We will show that
we can extract a lot of information about OQ
from this spacetime diagram on rotated graph paper,
whether or not we can easily construct
[by visualization and counting]
the clock diamonds for the inertial observer along OQ.
In general, a causal diamond on this rotated graph paper grid corresponds to a relative velocity of OQ, which is a rational number. As mentioned above, when that relative velocity corresponds to a rational Doppler-Bondi k-factor, we can then go further and easily construct the clock diamonds for the inertial observer along OQ.
Henceforth, we will only assume that we are dealing with
rational relative-velocities.
The Aspect-Ratio formula and the Area formula
- there are ##\Delta u=8## clock-diamond [future-]forward-edges
- there are ##\Delta v=2## clock-diamond [future-]backward-edges (sorry, this v is not velocity)
- The Aspect-Ratio equals the square of the Doppler-Bondi factor
##k^2=\frac{\Delta u}{\Delta v}=\frac{8}{2}=4=(2)^2## - The Area equals the square interval of the timelike diagonal OQ
##(\Delta s)^2=\Delta u\Delta v=(8)(2)=16=(4)^2## - The apparent elapsed time from O to Q is the average ##\Delta t=\frac{\Delta u+\Delta v}{2}=\frac{8+2}{2}=5##
- The apparent spatial distance from O to Q is the half the difference ##\Delta x=\frac{\Delta u-\Delta v}{2}=\frac{8-2}{2}=3##
Note:
- ##k^2=\frac{\Delta u}{\Delta v}=\frac{\Delta t+\Delta x}{\Delta t-\Delta x}= \frac{1+\frac{\Delta x}{\Delta t}}{1-\frac{\Delta x}{\Delta t}}=\frac{1+V}{1-V}## (the square of the Doppler formula).
- It’s helpful to have to inverse relation:
Velocity ##V=\frac{\Delta x}{\Delta t}=\frac{\frac{1}{2}(\Delta u-\Delta v)}{\frac{1}{2}(\Delta u+\Delta v)}=\frac{\frac{\Delta u}{\Delta v}-1}{\frac{\Delta u}{\Delta v}+1}=\frac{k^2-1}{k^2+1}##
- It’s helpful to have to inverse relation:
- ##(\Delta s)^2=\Delta u\Delta v=(\Delta t+\Delta x)(\Delta t-\Delta x)=(\Delta t)^2-(\Delta x)^2## (the usual square-interval formula)
So, with ##k=2##, we have Velocity ##V=\frac{(2)^2-1}{(2)^2+1}=3/5##, which agrees with ##\frac{\Delta x}{\Delta t}=\frac{3}{5}##. With ##(\Delta s)^2=16##, which happens to be a perfect-square, we have ##\Delta s=4##. (Here is that Pythagorean triple (3,5,4).)
You may have guessed that the causal diamond of OQ comes from the calibration problem for Bob’s clock diamonds. If you are only interested in the “size of OQ” and you are okay calculating it by counting the number of Alice’s Clock Diamonds inside the causal diamond of OQ and taking a square root, you are done.
Visualizing Bob’s clock diamonds is icing on the cake… but isn’t strictly necessary. (It would be needed if wanted to ask how Bob would make analogous measurements.)
Since we can, let’s now draw in Bob’s light clock diamonds by dividing the diagonal OQ into 4 equal pieces and drawing rescaled parallelograms visually similar to the causal diamond of OQ. So, we draw 4 clock diamond diagonals.
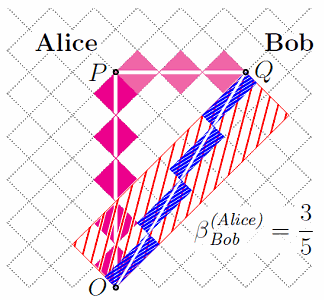
Special Relativity: what would Bob measure?
Note that Bob’s Clock Diamonds sets up a coordinate grid for Bob.
in terms of Bob’s clock diamonds,
- there are ##\Delta u=4## clock-diamond [future-]forward-edges
- there are ##\Delta v=4## clock-diamond [future-]backward-edges
- The Aspect-Ratio equals the square of the Doppler-Bondi factor
##k^2=\frac{\Delta u}{\Delta v}=\frac{4}{4}=1=(1)^2## - The Area equals the square-interval of the timelike diagonal OQ
##(\Delta s)^2=\Delta u\Delta v=(4)(4)=16=(4)^2## - The apparent elapsed time from O to Q is the average ##\Delta t=\frac{\Delta u+\Delta v}{2}=\frac{4+4}{2}=4##
- The apparent spatial distance from O to Q is the half the difference ##\Delta x=\frac{\Delta u-\Delta v}{2}=\frac{4-4}{2}=0##
With ##k=1##, we have Velocity ##V=\frac{(1)^2-1}{(1)^2+1}=0##, which agrees with ##\frac{\Delta x}{\Delta t}=\frac{0}{4}##. Indeed, OQ is at rest according to Bob.
Note that ##(\Delta s)^2=16##, as Alice determined. The square-interval of OQ is invariant — its value is independent of the observer measuring it.
A non-trivial example: a relativistic elastic collision
We conclude with a non-trivial example that has many things that could be calculated by counting and using the energy-momentum analogs of the formulas above. (Energy is upward and momentum is horizontal, in analogy to time and space, as measured by Alice. The grid diamonds could be called “unit-mass diamonds”, as special cases of “mass diamonds”.)
In the energy-momentum diagram drawn by Alice, we describe
an elastic collision of two particles with rest-masses ##m_1=12## and
and ##m_2=8##, initial-Velocities ##V_{1,i}=-5/13## and ##V_{2,i}=15/17##,
and final-Velocities ##V_{1,f}=4/5## and ##V_{2,f}=-3/5##.
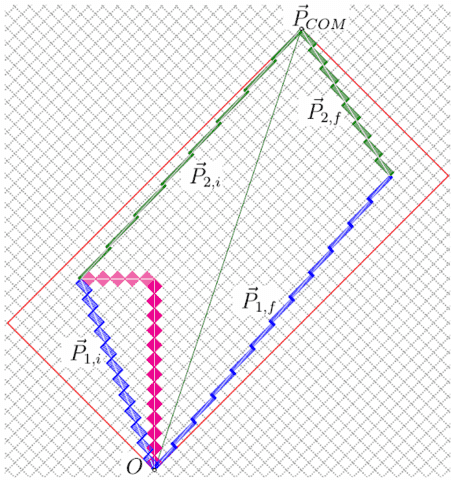
We invite the reader to verify the specified velocities for each incoming and outgoing particle.
Here are the calculations for “incoming particle 1” with rest-mass 12..
We have Velocity ##V_{1,i}=\frac{p_{1,i}}{E_{1,i}}=\frac{-5}{13}##.
Now, draw this particle’s mass-diamond with timelike diagonal ##\vec P_{1,i}##.
With ##u=8## and ##v=18## (note: the analogues of u=t+x and v=t-x yield u=(13)+(-5)=8 and v=(13)-(-5)=18), we have ##k_{1,i}^2=\frac{u}{v}=\frac{8}{18}=\frac{4}{9}## (so k=2/3 [a rational number]) and thus Velocity ##V_{1,i}=\frac{k_{1,i}^2-1}{k_{1,i}^2+1}=\frac{(4/9)-1}{(4/9)+1}=\frac{-5}{13}##. In addition, with the square-mass ##(m_{1,i})^2=uv=(8)(18)=144=(12)^2## [a perfect square], we verify that ##\vec P_{1,i}## (the “hypotenuse”) has 12 unit-mass diamonds along its timelike diagonal. Note that (5,13,12) forms a Pythagorean triple.
Try the other three.
Then consider the “total inital energy-momentum vector for the system” ##\vec P_{1,i}+\vec P_{2,i} ##. This describes the “center of momentum frame” (COM).
The system’s mass-diamond has size 40 by 20 with unit-mass diamond-edges in Alice’s frame. We have aspect ratio ##k_{COM}^2=40/20=2## [so ##k_{COM}## is irrational] and the Velocity of the center-of-momentum frame is ##V_{COM}=(2-1)/(2+1)=1/3##. The square-root of the area gives the magnitude of the total energy-momentum vector—the invariant-mass of this system of particles— ##m_{sys}=P_{COM} =\sqrt{(40)(20)}=\sqrt{800}## [not a perfect square].
Alternatively, one can construct a Minkowski-right triangle with ##\vec P_{COM}## as its hypotenuse, whose legs are (by counting) ##E_{tot,i}= 30## and ##p_{tot,i}= 10##
[or by analogous formula ##E_{tot,i}= (40+20)/2=30## and ##p_{tot,i}= (40-20)/2=10##] so that Velocity ##V_{COM}=\frac{p_{tot}}{E_{tot}}=10/30=1/3## (in agreement with above). Finally, we compute ##m_{sys}=\sqrt{{E_{tot}}^2-{p_{tot}}^2}=\sqrt{(30)^2-(10)^2}=\sqrt{800}## (in agreement with above).
Note that there are six reference frames here: Alice, the four incoming and outgoing particles, and the COM frame. Since the k-factors of the particles (and Alice) are rational numbers, we can easily draw (and thus count) their unit-mass-diamonds on Alice’s diagram. However, since the COM frame does not have a rational k-factor (and thus not a perfect square for its square-mass) we can’t easily draw the unit-diamonds in that frame… but we can calculate practically everything of physical importance.
Final comments
There’s more to the story… but that will have to be for another time.
[Some sections had to be omitted from the published paper… and there are extensions that still have to be worked out.] In any case, I hope that I’ve shown how this construction (with clock diamonds for beginners, and causal diamonds for more advanced folks) makes it easier to draw, interpret, and calculate with spacetime diagrams. So, let’s draw them!
Update: 8/24/2016
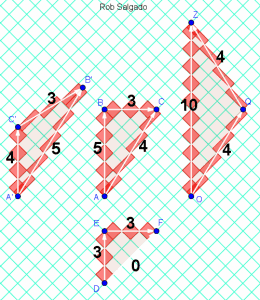
The last GeoGebra file features a tool to draw clock diamonds along segments so that one can more easily visualize the proper time along with timelike piecewise-inertial segments.
Further Reading
[copied from the earlier Insight]
“Relativity on rotated graph paper,” Roberto B. Salgado,
Am. J. Phys. 84, 344-359 (2016); http://dx.doi.org/10.1119/1.4943251
[see also the references within]
“The Clock Paradox in Relativity Theory,” Alfred Schild,
Am. Math. Monthly, 66, 1-18 (Jan., 1959); http://www.jstor.org/stable/2309916
Relativity and Common Sense, Hermann Bondi (Dover, 1962).
“Space-time intervals as light rectangles,” N. D. Mermin,
Am. J. Phys. 66, 1077–1080 (1998); http://dx.doi.org/10.1119/1.19047
Visualizing proper-time in Special Relativity”, Roberto B. Salgado,
Phys. Teach. (Indian Physical Society), 46, 132–143 (2004);
available at http://arxiv.org/abs/physics/0505134
Relativity on Rotated Graph Paper
Learn About Relativity on Rotated Graph Paper
Learn About Spacetime Diagrams of Light Clocks
Professor of Physics (BS,MS,PhD), Math (BS). Interested in relativity, physics, mathematics, computation, physics pedagogy.



I recently gave a talk at the 2016 MAA MathFest.My slides have been posted here (at the session organizer's website)https://www.framingham.edu/faculty/smabrouk/Maa/mathfest2016/tcps9/and the GeoGebra files I created for the presentation are available herehttps://www.geogebra.org/m/HYD7hB9v#The last GeoGebra file features a tool to draw clock diamonds along segmentsso that one can more easily visualize the proper-time along timelike piecewise-inertial segments.
thanks, i think i will to open an account at the site and buy the full paper.
Thanks.That Insight and the early one describe key features of my AJP paper. Details are in the paper. There is an earlier draft athttp://arxiv.org/abs/1111.7254The post below describes the major changes since that draft version.https://www.physicsforums.com/threads/spacetime-diagrams-of-light-clocks-comments.875884/#post-5502068
thank you for the great insight.is the article;Am. J. Phys. 84, 344-359 (2016); http://dx.doi.org/10.1119/1.4943251Reference https://www.physicsforums.com/insights/relativity-rotated-graph-paper/the same article posted here?it is a pay per view as far as I can tell. I would like to download it in a more readable format ie printable.
It's useful to draw such graphs. Also Minkowski diagrams can be useful to visualize the results of algebraic calculations, but indeed as you say, you have to get used to them.
[QUOTE="vanhees71, post: 5526219, member: 260864"]I can draw Minkowski diagrams, but I never found them very helpful compared to just using the formulae, based on the covariant Minkowski-space formalism. My main trouble with Minkowski diagrams is that I have to forget the intuition we are used to from elementary school on interpreting the "paper plane" as a Euclidean plane.”In my opinion, one has to refine (or relax) one's intuition sincesome features (e.g. incidence, parallelism, and scaling) are common to Euclidean and Minkowski geometries…and some features (e.g., "circles", tangency to "circles" as "perpendicular" to radii, "angle"="arclength"/"radius") are analogousand some features (e.g., sum of the angles in a triangle = 180 degrees) have to be discarded.Do you find it useful to draw position-vs-time graphs (Galiliean space-time diagrams) when doing PHY 101 kinematics problems?
[QUOTE="pervect, post: 5523552, member: 14402"]I've noticed many PF posters seem to have difficulties in drawing space-time diagrams (or perhaps it's just reluctance?). I'm not sure how to interpret this. I often suggest drawing time lines of events as a warm up exercise, hopefully that is a familiar exercise that will get across the abstract notion that one not only can draw a diagram that represents time, one has probably already done so in the past. I'm not sure if anyone has ever taken me up on my suggestion though, or if it's helped any.”I can draw Minkowski diagrams, but I never found them very helpful compared to just using the formulae, based on the covariant Minkowski-space formalism. My main trouble with Minkowski diagrams is that I have to forget the intuition we are used to from elementary school on interpreting the "paper plane" as a Euclidean plane.
your approach is very beautiful and motivates me to think of using it for other areasthanks
Great Insight @Robphy!
It seems that students generally don't draw useful diagrams: position-vs-time graphs or free body diagrams. Rather they try to reason with words, with possibly flawed intuition (especially on non-intuitive situations), and with formulas awaiting input. If a diagram is drawn, it's usually more of a cartoon rather than a diagram approximating the geometry of the situation.For Relativity, I think not knowing where the tickmarks adds an additional obstacle. This is what motivated my approach.
I've noticed many PF posters seem to have difficulties in drawing space-time diagrams (or perhaps it's just reluctance?). I'm not sure how to interpret this. I often suggest drawing time lines of events as a warm up exercise, hopefully that is a familiar exercise that will get across the abstract notion that one not only can draw a diagram that represents time, one has probably already done so in the past. I'm not sure if anyone has ever taken me up on my suggestion though, or if it's helped any.It doesn't seem like much of a leap to go from drawing time-lines to drawing space-time diagrams, but I suspect the later seems harder than the former.The end goal (as I see it) is to lead the reader to the realization that every event in space-time, aka "reality", is represented by one point on the space-time diagram, and that this is true no matter whose perspective the diagram is drawn from. This doesn't seem too outlandish, or hard, but it does involve the notion of one-one correspondences between infinite sets. Maybe it's the lingering (and perhaps somwhat justified) fear that there are non-intuitive aspects to infinite sets that causes the difficulties? I really don't know for sure, I suppose that it's something that would take a lot of 1:1 private converstations to get an appreciation of the issues – it's just too difficult to get anyone to talk about what they don't understand in a public forum.
While I haven't done any detailed surveys or pre-/post-exams…,I feel that this method does a better job of motivating and explaining relativityover approaches that rely heavily on the Lorentz transformation formulas and other formulas (time-dilation, length-contraction,…).(In a formulaic approach, the problem [for the students] seems to boil down to determining which quantities are primed and which are unprimed.)In my opinion, constructing the diagram emphasizes the operational interpretation of relativistic quantities… with minimal mathematical requirements for the end user.I like to think of it as a "physics first, [Lorentz Transformation] formulas later".Then, having a completed diagram encodes many "tangeable" features that could be used for further discussion and elaboration [reinterpreted with standard formulas, if desired].Hopefully, this helps make it easier to draw and interpret spacetime diagrams.
How well did you feel that it worked? Did it help the students gain an intuition for SR?
As far as I know, I am the only one who has tried it in a relativity class or in an intro class (calc-based and algebra-based) discussing the topic of relativity. I have used the clock diamonds… But not the fancier causal diamond methods (yet).
Do you know if anyone has used this approach in an introductory relativity class?