4.1.26 graph of velocity over acceleration graph

  • #1
karush
Gold Member
MHB
3,269
5
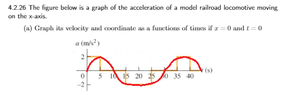
View attachment 9254

ok not finding this easy but the red is mine drawn over the given book graph

also want to convert the whole thing to tikx graph
 

Attachments

  • 4_2_26.png
    4_2_26.png
    7.3 KB · Views: 108
Mathematics news on Phys.org
  • #2
karush said:
ok not finding this easy but the red is mine drawn over the given book graph

also want to convert the whole thing to tikx graph

Is the problem's given acceleration graph the piece-wise linear graph in yellow?

Why the graph in red? What's its purpose?
 
Last edited by a moderator:
  • #3
yes only the red in mine

we are asked to plot velocity(red) over the given graph of acceleration
 
  • #4
for the given piece-wise linear acceleration graph in yellow, the velocity graph is as shown ...
 

Attachments

  • velocity_graf.jpg
    velocity_graf.jpg
    37.2 KB · Views: 99
  • #5
karush said:
ok not finding this easy but the red is mine drawn over the given book graph

also want to convert the whole thing to tikx graph

We can do for instance:
\begin{tikzpicture}[xscale=.3, >=stealth]
\draw[ystep=0.5,help lines] (0,-2.5) grid (45,2.5);
\draw[->] (-2,0) -- (47,0) node
{(s)};
\draw[->] (0,-2.4) -- (0,2.9) node[above] {$a$ (m/s$^2$)};
\draw
foreach \i in {5,10,...,45} { (\i,0.1) -- (\i,-0.1) node[below] {$\i$} }
foreach \i in {-2,2} { (0.3,\i) -- (-0.3,\i) node
{$\i$} }
(0,0) node[below left] {$0$};
\draw[red, ultra thick]
(5,2) parabola (0,0)
(5,2) parabola (10,0)
(15,-2) parabola (10,0)
(15,-2) -- (25,-2)
(25,-2) parabola (30,0)
(35,2) parabola (30,0)
(35,2) -- (40,2)
(40,2) parabola (45,0);
\end{tikzpicture}

I guess we still need to add the velocity graph.
For the section up to 10 seconds, we have the parabola given by:
$$a(t) = 2 - \frac{2}{25}(t-5)^2 = -\frac{2}{25}t^2+\frac 45 t$$
Integrate it, to find:
$$v(t) = \int_0^t a(t)\,dt = \int_0^t \left[-\frac{2}{25}t^2+\frac 45 t\right]dt
= \left[-\frac{2}{3\cdot 25}t^3 + \frac 25 t^2\right]_0^t = -\frac{2}{75}t^3 + \frac 25 t^2$$

Putting it in a graph, we get:
\begin{tikzpicture}[xscale=.3, yscale=.3, >=stealth]
\draw[help lines] (0,-2.5) grid (45,15);
\draw[->] (-2,0) -- (47,0) node
{(s)};
\draw[->] (0,-2.4) -- (0,15.9) node[above] {$v$ (m/s)};
\draw
foreach \i in {5,10,...,45} { (\i,0.3) -- (\i,-0.3) node[below] {$\i$} }
foreach \i in {-2,5,10,15} { (0.3,\i) -- (-0.3,\i) node
{$\i$} }
(0,0) node[below left] {$0$};
\draw[cyan, ultra thick] plot[domain=0:10, variable=\t] (\t, {-(2/75)*\t^3 + (2/5)*\t^2 });
\end{tikzpicture}

Repeat to find the later sections...
And integrate again to find the x graph...​
 

Similar threads

Replies
5
Views
1K
Replies
1
Views
2K
Replies
4
Views
2K
Replies
14
Views
2K
Replies
4
Views
2K
Replies
6
Views
590
Replies
3
Views
2K
Replies
11
Views
4K
Back
Top