Graphing Functions With Asymptotes and Discontinuity

In summary, the conversation is about a problem set and the person is seeking help and clarification on various questions related to it. The summary includes discussions on the graph, continuity, asymptotes, and domain. The person is provided with corrections and suggestions on their work, and they are grateful for the help. The summary also mentions a graph provided by the person and includes further discussions on asymptotes and intercepts.
  • #1
ardentmed
158
0
Hey guys,

I have a couple more questions about this problem set I've been working on. I'm doubting some of my answers and I'd appreciate some help.

Question:
08b1167bae0c33982682_8.jpg


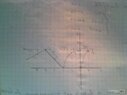
Sorry guys, I can't upload my sketched graph. But I can describe it:

Given the four conditions, I got a dicontinuous graph that decreases on all intervals except for [2,4] in which case it increases.

for 1b, the function is not continuous because $\lim_{{x}\to{a}}$ DNE since different values are approached for the left-hand and right-hand limits.

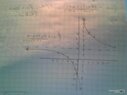
As for 2, I got a vertical asymptote at x=-2 since "x+2" crosses out in both the nominator and denominator after factoring the function to f(x) = (2x-3)(x+2) / (x+2)(x+1)

And the domain is just (-infinity, infinity)

For 2c, I got x=/1 and y=/2 for horizontal and vertical asymptotes respectively.
Thanks in advance.

Moreover, for 2d, seeing as to how x =/ -1 because the limits approach different values from both sides, I computed the following domain:

(-infinity, -1) u (-1, infinity)

Thanks a ton for the help. You guys are the best.
 
Physics news on Phys.org
  • #2
Can anyone help me out with this question?

Thanks in advance.
 
  • #3
I think the massive block of text and/or questions makes people less inclined to answer your question, but I will do so now.

Your description of the graph seems accurate. 1b) is not correct, check x = 2 and x = 4 and tell me what values they approach as you approach them from the left and right side.
 
  • #4
2) If you cross a factor from the numerator and denominator, you don't get an asymptote, you get a hole. You have an asymptote (vertical) only at x = -1. The domain is slightly wrong, because you did not include where the domain is undefined or doesn't exist. 2c) Your asymptotes are wrong, 2d) You left out the point discontinuity (hole). The domain is continuous for all x-values such that it doesn't equal x = -1 and 2.
 
  • #5
Rido12 said:
I think the massive block of text and/or questions makes people less inclined to answer your question, but I will do so now.

Your description of the graph seems accurate. 1b) is not correct, check x = 2 and x = 4 and tell me what values they approach as you approach them from the left and right side.

x=2 approaches 0 for both sides and f(2) = 0.

Also, x=4 approaches 2 for both sides and f(4) = 2.

Wouldn't that constitute continuity, or am I missing something crucial here?

Thanks for the help, guys.

- - - Updated - - -

Rido12 said:
2) If you cross a factor from the numerator and denominator, you don't get an asymptote, you get a hole. You have an asymptote (vertical) only at x = -1. The domain is slightly wrong, because you did not include where the domain is undefined or doesn't exist. 2c) Your asymptotes are wrong, 2d) You left out the point discontinuity (hole). The domain is continuous for all x-values such that it doesn't equal x = -1 and 2.

Alright, so for the domain, I computed:

(-$\infty$,-2)u(-2,-1)u(-1,$\infty$)

Am I on the right track?
 
  • #6
ardentmed said:
x=2 approaches 0 for both sides and f(2) = 0.

Also, x=4 approaches 2 for both sides and f(4) = 2.

Wouldn't that constitute continuity, or am I missing something crucial here?

Thanks for the help, guys.

Yes, that constitutes continuity, and it was what I was trying to point out. In your original post, you said that the function wasn't continuous. I was merely pointing out that it is indeed continuous at 2 and 4.
ardentmed said:
Alright, so for the domain, I computed:

(-$\infty$,-2)u(-2,-1)u(-1,$\infty$)

Am I on the right track?

Yes, that is correct.
 
  • #7
Rido12 said:
Yes, that constitutes continuity, and it was what I was trying to point out. In your original post, you said that the function wasn't continuous. I was merely pointing out that it is indeed continuous at 2 and 4. Yes, that is correct.

Here is my graph for 1a, by the way. Sorry, the webcam photos come out as inverted.

Thanks. View attachment 2909
 

Attachments

  • snapshot (3).jpg
    snapshot (3).jpg
    14.7 KB · Views: 49
  • #8
Almost! Remember to use an open circle when the endpoint is not included in the interval. If you have two dots filled-in with one directly above the other, then your graph would fail the vertical line test.
 
  • #9
Also, here is the (inverted) graph for 2.

As for asymptotes, I computed a vertical asymptote at x= -1, and horizonta asymptote at y=2.

The intercepts are: (3/2, 0) for the x intercept and (0, -3) for the y intercept. I rejected x = -2 as a possibility since that is where the point of discontinuity is situated at.

Thanks in advance. View attachment 2910

Edit: Oh, so for the first one, there should be a hole for x=0, right?
 

Attachments

  • snapshot (4).jpg
    snapshot (4).jpg
    15 KB · Views: 47
  • #10
ardentmed said:
Also, here is the (inverted) graph for 2.

As for asymptotes, I computed a vertical asymptote at x= -1, and horizonta asymptote at y=2.

The intercepts are: (3/2, 0) for the x intercept and (0, -3) for the y intercept. I rejected x = -2 as a possibility since that is where the point of discontinuity is situated at.

Thanks in advance. View attachment 2910

Edit: Oh, so for the first one, there should be a hole for x=0, right?

Yup, and your graph looks correct.
 

Related to Graphing Functions With Asymptotes and Discontinuity

1. What is an asymptote in a function graph?

An asymptote is a line that a function approaches but does not intersect. It can be either vertical or horizontal and indicates a value that the function cannot attain.

2. How do I determine the equations of asymptotes?

For a vertical asymptote, set the denominator of the function equal to zero and solve for x. For a horizontal asymptote, divide the coefficients of the highest degree terms in the numerator and denominator to get the equation of the line.

3. What is a discontinuity in a function graph?

A discontinuity is a point on a graph where the function is undefined or has a break in its continuity. This can be caused by a vertical asymptote or a removable discontinuity.

4. How do I graph a function with an asymptote or discontinuity?

Start by plotting points on either side of the asymptote or discontinuity to get an idea of the behavior of the function. Then, plot the points as they approach the asymptote or discontinuity and connect them with a dashed line to indicate that the function does not actually intersect that point.

5. Can a function have multiple asymptotes and discontinuities?

Yes, a function can have multiple asymptotes and discontinuities. This is often seen in rational functions, where there can be multiple vertical asymptotes and horizontal asymptotes. Additionally, there can be multiple points where the function is undefined or has a break in its continuity.

Similar threads

  • Calculus
Replies
5
Views
852
  • Calculus
Replies
7
Views
1K
Replies
1
Views
698
Replies
4
Views
1K
  • Calculus
Replies
1
Views
777
  • Calculus
Replies
4
Views
911
Replies
8
Views
710
Replies
5
Views
877
Replies
3
Views
1K
Back
Top