- #1
Prove It
Gold Member
MHB
- 1,465
- 24
View attachment 7269
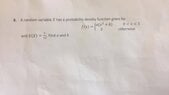
Since it's a PDF, that means the entire area under the curve must be 1, so
$\displaystyle \begin{align*} \int_0^1{ a \left( x^2 + b \right) \,\mathrm{d}x } &= 1 \\ a \left[ \frac{x^3}{3} + b\,x \right] _0^1 &= 1 \\ a \left[ \left( \frac{1^3}{3} + b\cdot 1 \right) - \left( \frac{0^3}{3} + b \cdot 0 \right) \right] &= 1 \\ a \left( \frac{1}{3} + b \right) &= 1 \\ a &= \frac{1}{ \frac{1}{3}+ b } \\ a &= \frac{3}{1 + 3\,b} \end{align*}$
Now as we are told $\displaystyle \begin{align*} E \left( X \right) = \frac{7}{12} \end{align*}$, so
$\displaystyle \begin{align*} \int_0^1{ a\left( x^2 + b \right) x\,\mathrm{d}x } &= \frac{7}{12} \\ a \int_0^1{ \left( x^3 + b\,x \right) \,\mathrm{d}x } &= \frac{7}{12} \\ \frac{3}{1 + 3\,b} \left[ \frac{x^4}{4} + \frac{b\,x^2}{2} \right] _0^1 &= \frac{7}{12} \\ \frac{3}{1 + 3\,b} \left[ \left( \frac{1^4}{4} + \frac{b \cdot 1^2}{2} \right) - \left( \frac{0^4}{4} + \frac{b \cdot 0^2}{2} \right) \right] &= \frac{7}{12} \\ \frac{3}{1 + 3\,b} \left( \frac{1}{4} + \frac{b}{2} \right) &= \frac{7}{12} \\ \frac{3}{1 + 3\,b} \left( \frac{1 + 2\,b}{4} \right) &= \frac{7}{12} \\ 12 \cdot 3 \left( 1 + 2\,b \right) &= 7 \cdot 4 \left( 1 + 3\,b \right) \\ 36 + 72\,b &= 28 + 84\,b \\ 8 &= 12\,b \\ b &= \frac{2}{3} \end{align*}$
and thus
$\displaystyle \begin{align*} a &= \frac{3}{1 + 3 \left( \frac{2}{3} \right) } \\ &= \frac{3}{1 + 2} \\ &= \frac{3}{3} \\ &= 1 \end{align*}$