Screw materials: AISI 316 vs A4-80

  • #1
Juanda
Gold Member
412
145
TL;DR Summary
Screws classified by ISO 3506-1 seem to show better mechanical properties than the parent material. I don't understand it.
To mods: I didn't know whether to post it here in Mech Engineering or in Materials Engineering. Feel free to move the thread if necessary. Also, let me know if posting pictures from the ISO may be a problem.

Stainless steel screws are denoted by their grade and property class (mechanical strength) in ISO 3506-1.


1721651655510.png


So the material itself is not typically defined. The chemical composition is defined which is technically enough but information about the alloy is harder to find.
1721652625807.png


For example, you may know you're buying an A4-80 screw but you don't initially know the alloy.
1721651808915.png


From other sources (or by matching the chemical composition), you may find that an A4 screw corresponds to an AISI 316 or stainless steel 18/10.
Link for A2 (AISI 304) vs A4 (AISI 316) stainless steel
A4 Stainless is often referred to as 316 or 18/10 stainless. As in A2 above, the numbers 18/10 refer to the chromium and nickel content- 18% chromium and 10% nickel.
A4 grade then is also austenitic, non-magnetic and suitable for all the situations as A2 BUT has the added advantage of being suitable for marine solutions. Often called Marine Grade stainless steel. The molybdenum increases the corrosion resistance to withstand attack from many industrial chemicals and solvents and of course, chlorides. Used in the production of inks, photographic chemicals, surgical implants, and the marine environment.

And here lies my question about the material. An A4-80 seems to have greater mechanical properties than what an AISI 316 has to offer.

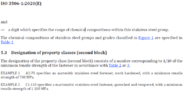
Here are the mechanical properties defined by ISO 3506-1.
1721652524500.png

1721652826411.png


So those properties of an A4-80 are considerably above what's available in an AISI 316.
1721652997683.png


How is that possible? It can't be that it's simply work hardened because that moves the yield point to the right but it shouldn't increase the ultimate tensile strength.
1721653072821.png


What am I missing?

This is the only instance I could find where the ultimate tensile strength comes near what is defined for the screws.
Still, I don't know how it's possible.
 

Attachments

  • 1721652466845.png
    1721652466845.png
    36 KB · Views: 8
  • Like
Likes berkeman
Engineering news on Phys.org
  • #2
  • #3
Juanda said:
TL;DR Summary: Screws classified by ISO 3506-1 seem to show better mechanical properties than the parent material. I don't understand it.

And here lies my question about the material. An A4-80 seems to have greater mechanical properties than what an AISI 316 has to offer.
That depends partly on the composition, where there is a relatively weak dependence on composition within the specified ranges, except possibly for Mn, in which some specifications only specify a 2.00% Max, while other specifications may apply a narrower range e.g., 1.0 - 2.0%, or 1.5 - 2.0%.

The other factor affecting strength is amount of work, usually cold work (e.g., by forging, rolling and/or drawing), also called hardening (hardness increases with cold work/strengthening). Austenitic stainless steels can be moderately cold-worked to 15% to 20%, or more heavily cold-worked to 30%, 40% up to 60%, with the higher levels being somewhat unusual.

The desired/required strength will depend on the function (and anticipated stresses and margin to some peak stress, ostensibly yield), and environment (e.g., dry, aqueous, corrosive agents, other materials in contact, . . . , and temperature). Crevice corrosion would potentially be a critical factor, as would fatigue.
 
  • Informative
  • Like
Likes DeBangis21, Lnewqban, berkeman and 1 other person
  • #4
Astronuc said:
That depends partly on the composition, where there is a relatively weak dependence on composition within the specified ranges, except possibly for Mn, in which some specifications only specify a 2.00% Max, while other specifications may apply a narrower range e.g., 1.0 - 2.0%, or 1.5 - 2.0%.

The other factor affecting strength is amount of work, usually cold work (e.g., by forging, rolling and/or drawing), also called hardening (hardness increases with cold work/strengthening). Austenitic stainless steels can be moderately cold-worked to 15% to 20%, or more heavily cold-worked to 30%, 40% up to 60%, with the higher levels being somewhat unusual.

If I understand correctly, you're saying that as long as you're within the margins for the chemical composition specified by AISI 316 (or any other, that's just the example being discussed) the mechanical properties shouldn't differ too much.
I agree with that. In fact, that's my main concern. The mechanical properties shouldn't vary much but they do.

If the only change were yield strength then I'd assume it is a matter of cold working but it's not the case as mentioned in the OP.
Juanda said:
How is that possible? It can't be that it's simply work hardened because that moves the yield point to the right but it shouldn't increase the ultimate tensile strength.
View attachment 348731

What am I missing?

This is the only instance I could find where the ultimate tensile strength comes near what is defined for the screws.
Still, I don't know how it's possible.


How can these three AISI 316 be so different from one another?
1721671792549.png


1721671817765.png


1721672102151.png


How could I know what an A4-80 is really made of? AISI 316 seems to be insufficient since that classification contains a wide range of properties.
 
  • #5
Juanda said:
If the only change were yield strength then I'd assume it is a matter of cold working but it's not the case as mentioned in the OP.
Work-hardening austenitic stainless steels will increase the yield strength and ultimate tensile strength, and necessarily reduce the uniform and total elongation. Working a material increases the dislocation density, which 'hardens', or strengthens the alloy. Most specifications, e.g., ASTM/SAE/ASME standards will refer to fully annealed (no cold work) material unless explicitly specified.

Grain size is another factor. Smaller grains produce greater strength (Hall-Petch, or Petch-Hall effect).
https://en.wikipedia.org/wiki/Grain_boundary_strengthening
https://www.sciencedirect.com/topics/engineering/petch-effect
https://www.sciencedirect.com/topics/materials-science/hall-petch-strengthening
https://royalsocietypublishing.org/doi/10.1098/rspa.2015.0890

Composition can influence the strength, perhaps a few ksi or 10s of MPa.

Stainless steel bolt A4-80 is composed of 316SS.
https://www.stainlesssteelfasteners.net/a4-70-a4-80-stainless-steel-hex-bolt/

Therefore, A4-80 is an austenitic, acid proof stainless grade (usually 316 material – 316 or 316L) which has been cold worked to provide a minimum tensile strength of 800N/mm² (MPa).
https://midlandbrightsteels.co.uk/a4-80/
 
  • Informative
  • Like
Likes Juanda and Lnewqban
  • #6
Astronuc said:
Work-hardening austenitic stainless steels will increase the yield strength and ultimate tensile strength, and necessarily reduce the uniform and total elongation. Working a material increases the dislocation density, which 'hardens', or strengthens the alloy. Most specifications, e.g., ASTM/SAE/ASME standards will refer to fully annealed (no cold work) material unless explicitly specified.
So that bit marked in bolt letters is new for me. I thought work-hardening (the net result of cold working if I understood correctly) could only increase the yield strength as shown in the picture previously shared and shown below again.
Juanda said:

Is that picture wrong then? That would be equivalent to cold working and the ultimate tensile load doesn't increase.
It is my understanding that, as you load the test piece, it'll move elastically from (1) to (2) where there is the actual yield of the material. The only way to know the yield point has been reached is to keep loading it a little so you know it yielded because the behavior changes (no longer linear behavior with E slope). Then you reach (4) which corresponds to a 0.2% elongation once the load is released. The part has yielded at point (4) so it doesn't return to its original shape. Next time it's loaded it'll follow the dotted line.
The new yield point is higher due to the dislocations that already occurred but the point I'm trying to make with this is that, according to that graph, the ultimate tensile load is the same. Also, the total elongation possible the material can take is the same although, if compared with the new yielded state, we could say the new total elongation it can take is reduced.


Astronuc said:
1721738718210.png

I don't see how grain boundary strengthening could change the ultimate tensile load. From what I could read, its impact is focused on the yield point which coincides with my previous understanding of how metals deform.
Also, grain size is determined by heat treatment so in any case, it'd be a separate point unrelated to cold-working they must be doing on the metals. It could be the reason the table shows the differentiation between soft and high strength (70 and 80 within A4) and I think you hit the nail with that one although the document doesn't show any additional clarification regarding what Soft vs High Strength means.
Juanda said:

I still don't understand how cold working can increase the ultimate tensile load...


TO SUM UP:
I believe I have a superficial understanding of how cold working increases the yield point of a material. Yield happens because crystal planes keep sliding over each other as load increases which is why Von Mises, a method focussed on tangential loads, gives such a good prediction on when yield of ductile metals will happen.
It yields as dislocations (crystal planes sliding) happen. These dislocations make it harder for further dislocations to occur. Eventually, there are so many dislocations already in place that sliding requires too much energy so the component snaps which requires less energy. It also explains how triaxial tension states result in fragile fractures of ductile materials because there is no chance for sliding to happen since there is no tangential stress present.
That explanation is compatible with the Grain Boundary Strengthening / Hall Petch Strengthening. The smaller the grains, the more errors in the crystal structure so sliding crystal planes is harder. As explained in the article, there is a limit to how small the grains contribute positively to the yield stress because, at a certain point, another failure mode will occur. The Wiki article contains more details about it.
However, I don't see in that reasoning how the increment of ultimate tensile load through cold working or grain size is possible.
 
  • #7
English is not my native language so for further clarification, I'm adding this picture.
1721743459095.png


Ultimate strength is what I have sometimes called ultimate tensile load.

I have also mentioned the 0.2 % elongation which refers to the proof load. From that last graph, it seems the yield point would be easily identifiable but in other graphs is not the case. That's why there is a need to keep loading it to notice the behavior change.
1721743939872.png


Still, proof stress seems to not have physical significance and it sometimes has different motivations so I think it just adds noise to this conversation. I suggest we avoid it.
In fact, as I was looking for more information about it an old post from @Astronuc popped up with the following.
Fred nailed this one right on!

If one checks a glossary in a reference book, one will find -
proof load
A predetermined load, generally some multiple of the service load, to which a specimen or structure is submitted before acceptance for use.

However,
proof stress
(1) A specified stress to be applied to a member or structure to indicate its ability to withstand service loads. (2) The stress that will cause a specified small permanent set in a material.

And it is the second definition which applies here.

IIRC, 0.1% strain offset has also been used in addition to the 0.2% offset, in the US. According to ASM's "Atlas of Stress-Strain Curves", in the UK (and perhaps outside of North America), offset yield strength is referred to as proof stress, and 0.1% or 0.5% is used.

The point of choosing 0.2% is that it is easier that 0.1% and not as much as 0.5%. Using the offset "avoids the practical difficulties of measuring the elastic or proportional limit" of a material. This is not so much a problem these days with digitally controlled tensile test systems, but it was significant 25 or more years ago before high quality digital electronics were available.

The idea was to get as close as reasonably possible to the elastic limit.
 
  • #8
Juanda said:
Is that picture wrong then? That would be equivalent to cold working and the ultimate tensile load doesn't increase.
The picture is not wrong, but that is only one cycle. One would have to repeat the test on the same specimen, which would show a greater yield (YS) and ultimate tensile strength (UTS), then repeat the test. Note that there is some permanent strain (deformation) once a material exceeds the proportional or yield strength. Above yield, the material is considered to 'flow' rather than creep. The close to the ultimate tensile strength, the greater the permanent deformation and subsequent YS and UTS.

There are two mechanisms operating in the austenitics.
‘Normal’ work hardening occurs as ‘dislocations’, (naturally occurring line defects that enable metals to be ductile), in the atomic lattice move during plastic deformation. With deformation the number of dislocations present in the metal tend to multiply. The stress fields around the dislocations interact due to their increased density, and the dislocations also form ‘tangles’, both factors contribute to the observed increase in the force required to move them. Individual ‘perfect’ dislocations can also ‘split’ to become two partial dislocations with an intervening stacking fault, where locally the structure becomes hexagonal close packed, HCP, rather than FCC. In those FCC metals/alloys with a low stacking fault energy, the area of stacking fault, i.e. separation of of the partial dislocations, can be quite large in relative terms. The importance of this is that the micromechanical processes known as cross slip and climb, which enable dislocations to bypass obstacles, other dislocations etc., require bringing the pair of partial dislocations back together. This is easier in high stacking fault energy alloys, and thus they work harden less rapidly. So the stacking fault energy of any FCC metal/alloy is a key parameter when it comes to work hardening. Alloying influences the stacking fault energy of the common FCC metals. This not so marked in the ferritic, (bcc), structure, as in this structure the stacking fault energy is considered to be very high, thus most dislocations are in their ‘perfect’ form and thus are able to climb and cross slip.

This is an advanced topic, and the reader is directed to academic texts such as, ‘Introduction to Dislocations’, by D. Hull and ‘The Plastic Deformation of Metals’, by R.W.K. Honeycombe, for a more complete picture of these micro deformation processes in metals.
https://bssa.org.uk/bssa_articles/m...-stainless-steels-during-plastic-deformation/

See some examples of strain hardening in this paper. Note the plot (Fig. 3) represents three separate tests.
Mechanical Behavior of 316L Stainless Steel after Strain Hardening
https://www.matec-conferences.org/articles/matecconf/pdf/2017/28/matecconf_2mae2017_02003.pdf

I will try to find some additional references besides the following:

https://www.sciencedirect.com/science/article/abs/pii/S0167577X19310444
https://www.sciencedirect.com/science/article/abs/pii/S1359645422000131
https://www.sciencedirect.com/science/article/pii/S2238785423004945 (Open access, but is not 316, but rather a TWIP steel with a nominal composition of Fe–16Mn-0.6C (wt.%). The TWIP steel was . . .
, , , cast by vacuum casting and then forged at 1173 K into a square billet (cross-sectional size: 35 mm × 45 mm). Steel plates with a thickness of 4 mm were cut from the billet and cold rolled to 2 mm-thick plates (thickness reduction of 50%). In order to acquire different grain sizes, the cold-rolled plates were annealed at 973–1273 K for 30 min. Then, fully austenitic microstructures with average grain sizes of 7.4, 17, 36.8 and 50.6 μm were obtained.
From casting, subsequent thermo-mechanical processing is critical in obtaining the desired microstructure and mechanical properties.
 
Last edited:
  • Like
Likes gmax137
  • #9
Astronuc said:
The picture is not wrong, but that is only one cycle. One would have to repeat the test on the same specimen, which would show a greater yield (YS) and ultimate tensile strength (UTS), then repeat the test. Note that there is some permanent strain (deformation) once a material exceeds the proportional or yield strength. Above yield, the material is considered to 'flow' rather than creep. The close to the ultimate tensile strength, the greater the permanent deformation and subsequent YS and UTS.
I'm having so much trouble understanding why the ultimate tensile strength (UTS) should increase due to the repetition of cycles...
I propose the following mental experiment. Imagine an extruded metal bar and cut it in half so both specimens can be assumed to have the same properties.
Let's use one of the specimens to determine the behavior of the metal on a tensile test. This is the result from the experiment (simplified so I can draw it more easily but with some resemblance to reality).
1722333589863.png

The interpretation would be:
  1. The specimen is suffering elastic deformation. If the load was released, it'd come back to its original shape.
  2. The elastic limit (yield limit) ##\sigma_y## is reached. Beyond this point, the specimen will acquire a permanent deformation. The crystalline structure of the specimen is changed by sliding planes (dislocations) which also introduces more defects in the mesh during the process which increases the yield point of the specimen. The process goes on until the UTS ##\sigma_{UTS}## is reached.
  3. The UTS is reached because necking starts. I was wondering if I'd add necking to this idealization since necking is the result of a weak point somewhere in the specimen. In an absolute ideal world, the specimen would keep increasing the load uniformly along its length until failure. Since necking is a constructive defect (the reduction in the area causes a local increment in stress) as soon as it starts the maximum axial load is reached. I propose we ignore necking and just imagine the specimen snaps once ##\sigma_{UTS}## is reached.
Now, for the second specimen, I'll repeat the tensile test but I'll do it in steps/cycles as you suggested. My claim is that those cycles will increase ##\sigma_y## but not ##\sigma_{UTS}##. I'll plot first on top of the previous graph.
1722336784098.png

  1. Cycle A→B→A (red). The specimen didn't reach its elastic limit so it comes back to its original shape without changes.
  2. Cycle A→C→D→F (orange). Yield has occurred. A new yield limit is established at D. F is the new resting length of the specimen.
  3. Cycle F→G→F (green). The specimen was permanently deformed in the previous cycle but this new stress cycle doesn't produce additional permanent deformation even if the stress level is above C which originally defined the yield strength. As mentioned in the previous cycle, the new yield limit is at D.
  4. Cycle F→D→H (purple). The specimen is loaded until the ultimate strength is reached (either it breaks or necking starts, I propose we ignore what happens beyond that point).
I don't see how adding more cycles would affect the UTS (ignore more complex things such as fatigue please). The yield point increases which has been established and accepted from early in the thread but the increment in UTS is still something I can't understand.

The load cycles could be shown starting from 0 but that changes nothing since the information is still the same. I consider the previous graph to be clearer for what we are discussing but I'll add these additional drawings because it's how it's usually shown in material's datasheets and a paper shared in the thread.
I'll show what I consider the relevant paths. This is A→C→H and F→D→H.
1722338869437.png


Am I misunderstanding something in what I showed above?

Astronuc said:
As the page suggests this is a complex topic so I could be misunderstanding what it says but, doesn't it only talk about when plastic deformation occurs? In other words, it's talking about how cold working increases the yield point with which I fully agree. However, it doesn't reference how the increment in UTS happens.

Astronuc said:
See some examples of strain hardening in this paper. Note the plot (Fig. 3) represents three separate tests.
Mechanical Behavior of 316L Stainless Steel after Strain Hardening
https://www.matec-conferences.org/articles/matecconf/pdf/2017/28/matecconf_2mae2017_02003.pdf
I read the paper and it doesn't explain the increment in UTS either. In fact, in the introduction I read the following:
Tensile tests of 316H stainless steels with strainhardening up to 4%, 8% and 12% at room temperature in Ref. [4] found that the values of Young'smodulus and the ultimate strengths are similar for different strain hardening, but the yield strengthsincrease with the magnitudes of strain hardening at different temperatures.
That coincides with what was my previous understanding of how metals work. The origin of this thread is that statement collides with the huge variations in UTS shown in screws that are supposed to be made of the same material as shown in the OP.
The previous statement is also shown in Section 3 with the following graphs and table where you can see the relevant change in yield strength but the basically same UTS.
1722338923216.png


Even if there is a positive relation between strain hardening and UTS, the effect and number of tests from that paper are so small it'd be argued if the change is relevant at all. Even if it is, it is nowhere close to the huge change in properties I shared in the OP.


So far, the explanation I think covers the increment in UTS is related to this picture:
Source
1722339274522.png


Cold working could be any mechanical stress on the specimen such as a tensile test. Tensile tests will increase the yield point if the specimen is taken beyond the elastic region but the UTS will remain the same. However, if the specimen is cold worked in a specific way such as being rolled or extruded/pulled so the crystalline structure changes in a relevant way without breaking the parent material, the UTS can be increased.
For example, steel wire usually shows greater mechanical properties compared with a billet of the same material and according to what I found, screws are made of steel wire.
This of course would make the specimen more brittle just as shown earlier in this post but I think there is another relevant difference. The material would no longer show isotropic behavior because the crystalline mesh is no longer uniformly random. The UTS might have been increased in a particular direction but I feel it must have decreased in others.
Would you say this is correct?
 
  • #11
Juanda said:
Even if there is a positive relation between strain hardening and UTS, the effect and number of tests from that paper are so small it'd be argued if the change is relevant at all. Even if it is, it is nowhere close to the huge change in properties I shared in the OP.
The magnitude of change in UTS as a function of cold work, or strain, is less than the magnitude of change in YS. Normally, when one does a tensile test, one tests to completion, i.e., beyond UTS to failure. However, one can test to a strain less then uniform elongation, unload and reload, but then it's not the same material since some permanent (plastic) deformation has occurred.

One has to look at the composition, cold work and grain size of the alloy(s), each of which contributes to YS, UTS and elongation.

Austenitic steels are fcc (face-centered cubic), so the mechanical properties are essentially isotropic.

I have seen scatter in tensile tests where the measured YS varies from 80 to 110 ksi (550 to 760 MPa) for the same nominal material (with 20% cold work), and UTS varied from 110–125 ksi [758–862 MPa]. The nominal cold work of 20% is in actuality 18 to 22% CW, and grain size can also vary. A lot depends on the thermo-mechanical processing which is often done in cycles from billet to bar to rod (final draw after last solution annealing). How one anneals (temperature and time) can affect residual stresses carried over from the prior mechanical reduction.

Strain rate is yet another factor that affects tensile test results.
 
Back
Top