SaschaSIGI
- 3
- 0
Hello everybody,
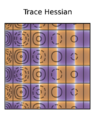
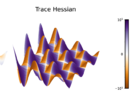
I have a question regarding this visualization of a multidimensional function. Given f(u, v) = e^{−cu} sin(u) sin(v). Im confused why the maximas/minimas have half positive Trace and half negative Trace. I thought because its maxima it only has to be negative. 3D vis
2D visualization
I have a question regarding this visualization of a multidimensional function. Given f(u, v) = e^{−cu} sin(u) sin(v). Im confused why the maximas/minimas have half positive Trace and half negative Trace. I thought because its maxima it only has to be negative. 3D vis
2D visualization
 ?
?