I Determining directional Field for say ##\dfrac{dy}{dx}=y-x##

  • I
  • Thread starter Thread starter chwala
  • Start date Start date
  • Tags Tags
    Curves
chwala
Gold Member
Messages
2,827
Reaction score
415
TL;DR Summary
What are the key factors to consider when determining the directional fields for curves/straight lines?
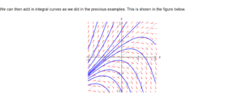
I am looking at this now : My understanding is that in determining the directional fields for curves; establishing the turning points and/or inflection points if any is key...then one has to make use of limits and check behaviour of function as it approaches or moves away from these points thus giving us a family of curves. For the question posted here , ...we set ##\dfrac{dy}{dx}=0, c=y-x## and then proceed to get a family of curves (isoclines) then proceed to check the behaviour of other values in the neighbourhood of the parallel lines.

Pretty clear but i may have missed on something hence my post.
 

Attachments

  • directional fields.png
    directional fields.png
    20.2 KB · Views: 109
Physics news on Phys.org
fresh_42 said:
Appreciated...i just wanted to check that my reasoning is correct; then i should be able to determine stability/asymptotic stability or unstability of solutions related to these fields...refreshing on this. cheers man.

and i just clicked the linear differential equation on wolfram. How did they end up with the constant ##1## on ##y=c_1e^x+x+1## in my working i have

##\dfrac{dy}{dx}-y=-x##

using integration factor,

##e^{\int({-1})dx}= \dfrac{1}{e^x}##

...
I end up with,

##ye^{-x} = \int (-xe^{-x} )dx##

...and on integration by parts on rhs... i get,

##ye^{-x}=xe^{-x}+e^{-x} +c##

##y = x+1+ce^x## ahhhh ok boss i can see :cool: .

nice day.
 
Last edited:
chwala said:
Appreciated...i just wanted to check that my reasoning is correct; then i should be able to determine stability/asymptotic stability or unstability of solutions related to these fields...refreshing on this. cheers man.
It is similar to what we call "curve discussion" here, and Wiki "curve sketching": differentiate the function three times, determine the zeros, plug in the zeros from one derivative into the other ones, and draw the curve with the information about zeros, local minima, local maxima, asymptotes, inflection points, convex, and concave areas, etc.

It is only a bit more complicated with differential equation systems, but yes, determine as much data as possible: repellers, attractors, possible flows, and so on.
 
Are you trying to plot a Vector Field; specifically here, f(x,y)=y-x, and/or its Characteristic curves?
 
Last edited:
WWGD said:
Are you trying to plot a Vector Field; specifically here, f(x,y)=y-x, and/or its Characteristic curves?
Not really,... Just looking at how to plot directional fields...
 
There is the following linear Volterra equation of the second kind $$ y(x)+\int_{0}^{x} K(x-s) y(s)\,{\rm d}s = 1 $$ with kernel $$ K(x-s) = 1 - 4 \sum_{n=1}^{\infty} \dfrac{1}{\lambda_n^2} e^{-\beta \lambda_n^2 (x-s)} $$ where $y(0)=1$, $\beta>0$ and $\lambda_n$ is the $n$-th positive root of the equation $J_0(x)=0$ (here $n$ is a natural number that numbers these positive roots in the order of increasing their values), $J_0(x)$ is the Bessel function of the first kind of zero order. I...
Are there any good visualization tutorials, written or video, that show graphically how separation of variables works? I particularly have the time-independent Schrodinger Equation in mind. There are hundreds of demonstrations out there which essentially distill to copies of one another. However I am trying to visualize in my mind how this process looks graphically - for example plotting t on one axis and x on the other for f(x,t). I have seen other good visual representations of...
Back
Top