Displacement-Time Graph Velocity of Objects X & Y

In summary, the gradient of the displacement time graph is the velocity. The gradient of $X$ is $\frac{5}{3}$ meters per second, and the gradient of $Y$ is $5$ meters per second. The options (1), (2), and (4) are false, while (3) is true because the displacement is equal at $t=6$.
  • #1
mathlearn
331
0
View attachment 6152

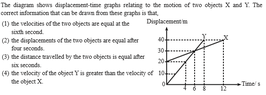
The gradient of the displacement time graph is the velocity.

Gradient of x = $\frac{y_1-y_2}{x_1-x_2}=\frac{30-40}{6-12}=\frac{-10}{-6}=\frac{5}{3}$ meters per second

Gradient of y = $\frac{y_1-y_2}{x_1-x_2}=\frac{0-40}{0-8}=\frac{-40}{-8}=5$ meters per second

Therefore the first option is false the second is also so not true, according to my calculations above the fourth option is true,and also it looks like the third is also true as the displacement is equal

Many Thanks :)
 

Attachments

  • displacement.png
    displacement.png
    8.4 KB · Views: 67
Mathematics news on Phys.org
  • #2
I agree with you on (1), (2) and (4). Concerning (3), displacements are indeed equal at $t=6$. According to Wikipedia, displacement is the difference between the final and initial position vectors. In this problem, apparently, objects move along a line, so instead of vectors we may consider their position $s(t)$ at time $t$ on the line. Suppose displacement is counted relative to some initial time $t_0$. ($t_0$ cannot be 0 because $s_X(0)-s_X(t_0)=20$.) So
\begin{align}
s_X(6)-s_X(t_0)&=30\\
s_X(0)-s_X(t_0)&=20,
\end{align}
from where $s_X(6)-s_X(0)=10$. Similarly, $s_Y(6)-s_Y(0)=30$. The graph shows that the objects did not change the direction, so the distance $X$ traveled between $t=0$ and $t=6$ equals $|s_X(6)-s_X(0)|=10$, while the distance $Y$ traveled is 30.
 

Related to Displacement-Time Graph Velocity of Objects X & Y

1. What is a displacement-time graph?

A displacement-time graph is a visual representation of an object's displacement (or change in position) over a period of time. The horizontal axis represents time, while the vertical axis represents displacement.

2. How can I calculate the velocity of Objects X & Y from a displacement-time graph?

The velocity of an object can be calculated by finding the slope of the displacement-time graph. To calculate the slope, choose two points on the graph and use the formula velocity = (change in displacement)/(change in time).

3. What does a positive slope on a displacement-time graph indicate?

A positive slope on a displacement-time graph indicates that the object is moving with a constant positive velocity. The steeper the slope, the greater the velocity.

4. How does the velocity of Object X compare to Object Y on a displacement-time graph?

The velocity of Object X can be determined by comparing the slopes of its displacement-time graph to that of Object Y. If Object X has a steeper slope, it is moving with a greater velocity than Object Y. If Object X has a shallower slope, it is moving with a slower velocity than Object Y.

5. Can the velocity of an object change on a displacement-time graph?

Yes, the velocity of an object can change on a displacement-time graph. This is indicated by a change in the slope of the graph. A steeper slope represents a greater velocity, while a shallower slope represents a slower velocity.

Similar threads

Replies
3
Views
979
  • General Math
Replies
20
Views
1K
  • Linear and Abstract Algebra
Replies
17
Views
1K
  • Calculus and Beyond Homework Help
Replies
5
Views
454
Replies
5
Views
1K
Replies
4
Views
1K
Replies
5
Views
942
Replies
1
Views
4K
Replies
1
Views
156
  • Introductory Physics Homework Help
Replies
10
Views
1K
Back
Top